Step through the pipeline
The pipeline, stage by stage
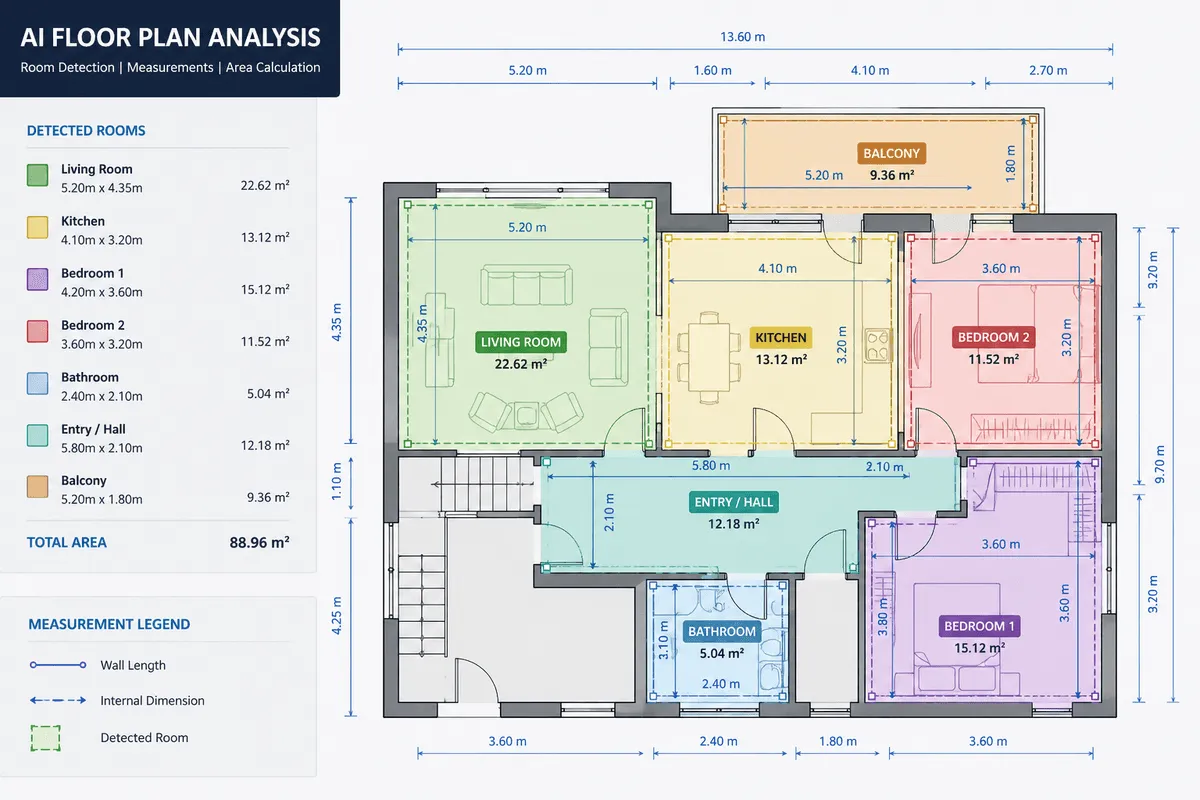
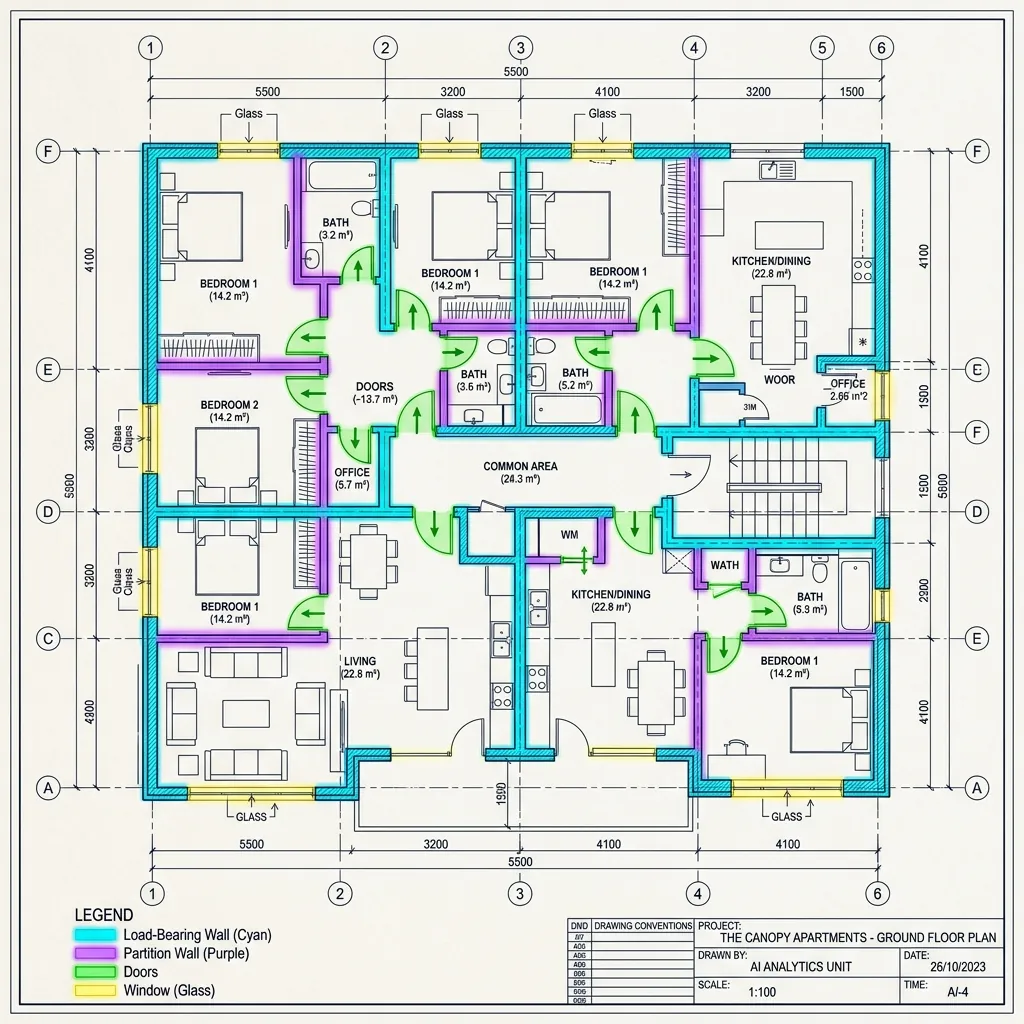
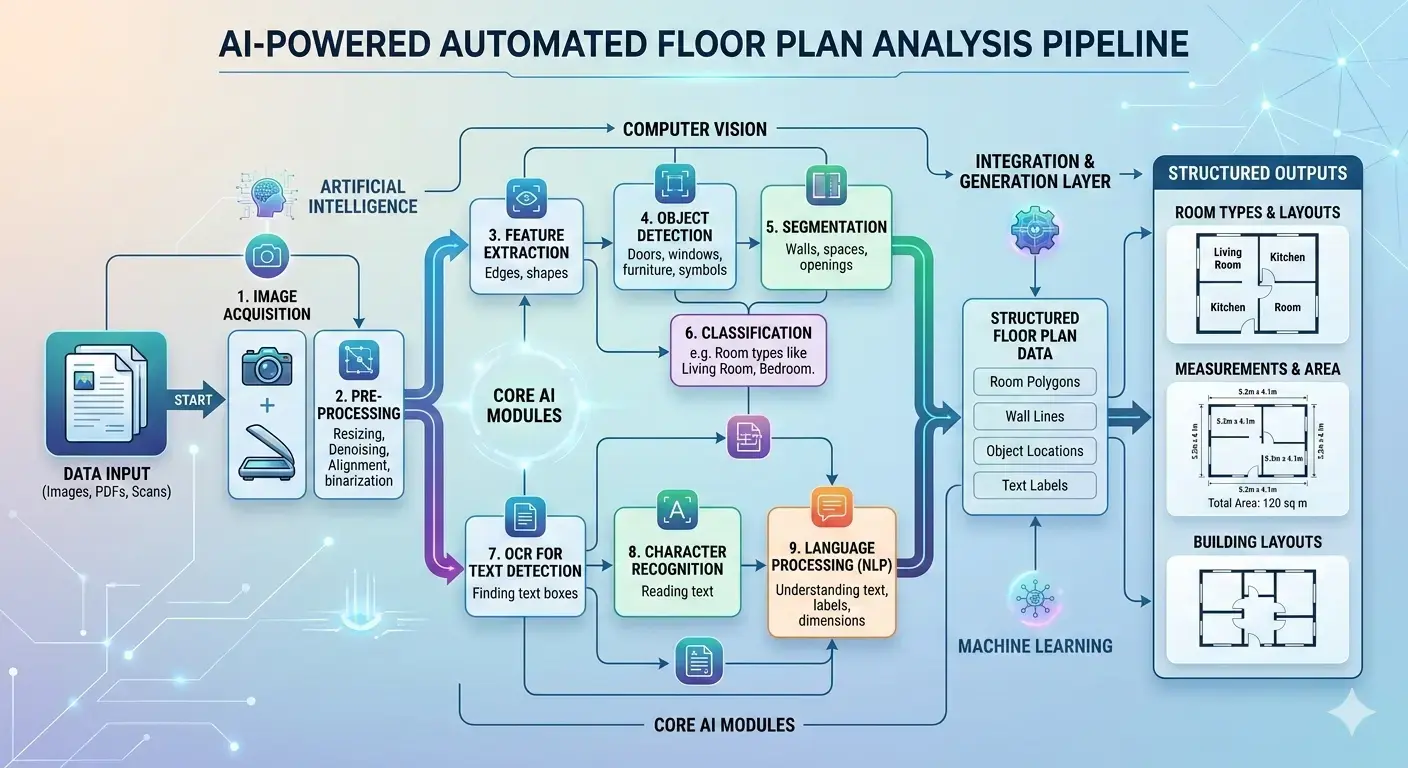
Pick a stage on the left and watch the overlays and the structured output change.
Pipeline stages
Run the steps in order
Stage info & metrics
1. Preprocessing & Denoising
Scanned blueprints and PDFs are deskewed, contrast-adjusted, and cleaned of noise. Tiling algorithms split high-resolution canvases into patches for processing.
Slide to simulate bilateral filter noise reduction layers.
Interactive demo on a sample residential drawingStage 1 of 5
How it works
Under the Hood of Spatial AI
A production pipeline requires separating geometric segmentation, symbol instance classification, and intelligent text mapping. Read about each component below.
HRNet Wall Segmentation
Wall segmentation is treated as a semantic pixel classification task. We employ high-resolution network configurations that preserve detailed line borders, ensuring wall junctions and columns do not create artificial gaps.
YOLOv8 Instance Detection
Door swings, window models, and mechanical symbols are identified using custom-trained YOLOv8 classifiers. Our models support Oriented Bounding Boxes (OBB), detecting rotated items at any angle.
Intelligent OCR (I-OCR)
Blueprints feature vertically running dimensions and text overlapping with hatch patterns. We deploy custom text-region spotters (like DBNet) that detect, deskew, and transcribe annotations with high reliability.
Topological Adjacency Graphs
Reconstructed room boundaries and doors are parsed to build mathematical routing networks. This spatial graph calculates room connectivity, allowing building codes and path distances to be audited automatically.
Automate Your Estimate Pipelines
AxcelerateAI builds customized drawing extraction pipelines that interface directly with Procore, Revit, or proprietary databases.
Schedule Tech Discovery Call