Automated valuation models
AI Property Valuation & Forecasting
- Photos and floor plans as inputs
- Value range with drivers
- Runs in your own cloud
- Type
- Single-family
- Beds / baths
- 3 / 2
- Listed area
- 1,640 sq ft
- Built
- 1998
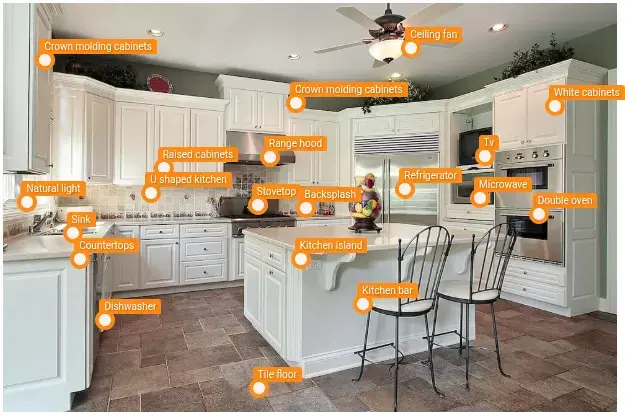
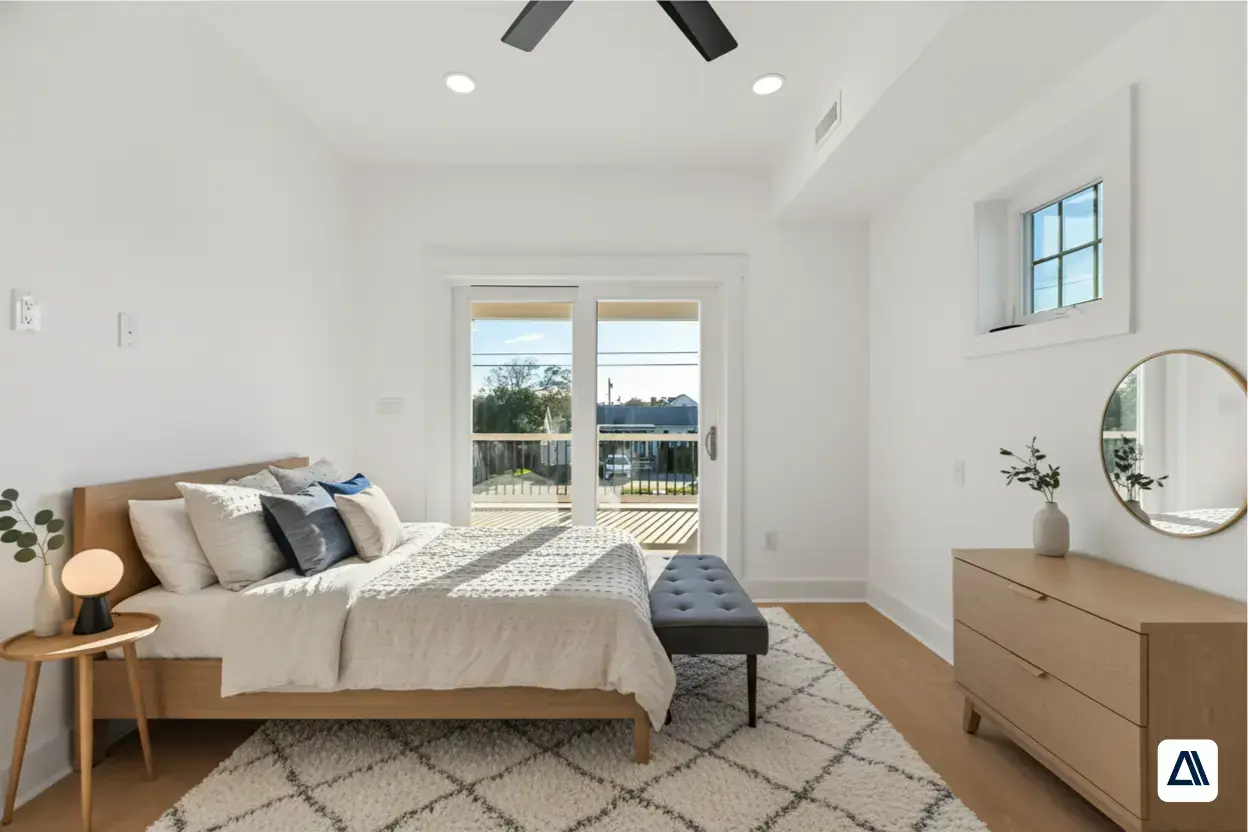
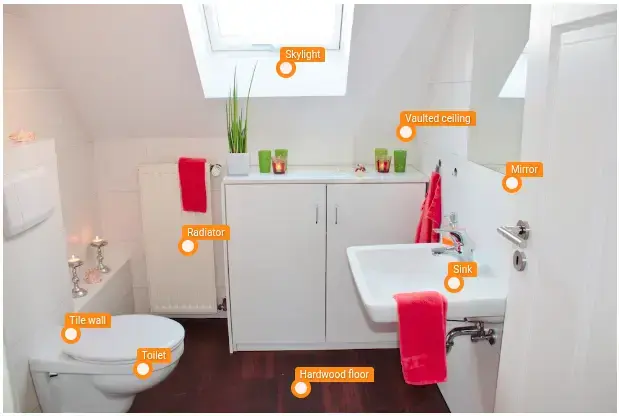
- 9 Birch Ct$493k
- 212 Elm Row$517k
- 47 Cedar Way$505k
- 18 Maple Dr$514k
1/4Listing attributes, photos, the floor plan and nearby sales are collected for the property. This sample house is fictional.
Why valuations drift
Comps and tax records miss what buyers pay for
Two homes with the same size, bedroom count and postcode can sell for very different prices. The difference is condition, finish and layout, and that rarely appears in structured data.
Lagging comps
Sales take months to reach public records. By then rates, zoning or demand may already have moved.Condition is invisible
A renovated kitchen and a dated one look identical in a tax record. Appraisers judge it by eye, inconsistently.Manual comp picking
Analysts pick comparables differently, so the same property can get different values from different people.Spreadsheet bottleneck
Pulling comps, rent rolls and assumptions into underwriting models by hand slows every offer.
| Topic | Traditional valuation | AI-assisted valuation |
|---|---|---|
| Inputs | Location, attributes and recent comparable sales | The same, plus features extracted from listing photos and floor plans |
| Condition | Subjective judgment from an inspection or listing review | A condition score and finish tags for every property, scored the same way |
| Comparables | Chosen by hand, different per analyst | Ranked by similarity with configurable weights |
| Output | A single price estimate | A value range, confidence score and the drivers behind the number |
How it works
From raw property data to an explainable value
Property appraisal automation only works if images and drawings are handled properly. They don't go into the model as pixels: specialist models turn them into structured features first, and the valuation model works on those.

- Stage 1
Collect property and market data
Listing attributes, MLS feeds, tax and deed records, rent rolls, zoning and demographic data are pulled together for each property, alongside recent sales nearby.One record per property - Stage 2
Extract features from photos
Photos are cleaned (duplicates, blur, low light), sorted into interior and exterior views, then scored for condition and finish. Object detection tags features such as pools, garages and kitchen islands.Condition score and feature tagsCNNsVision transformersYOLO detectors - Stage 3
Measure the floor plan
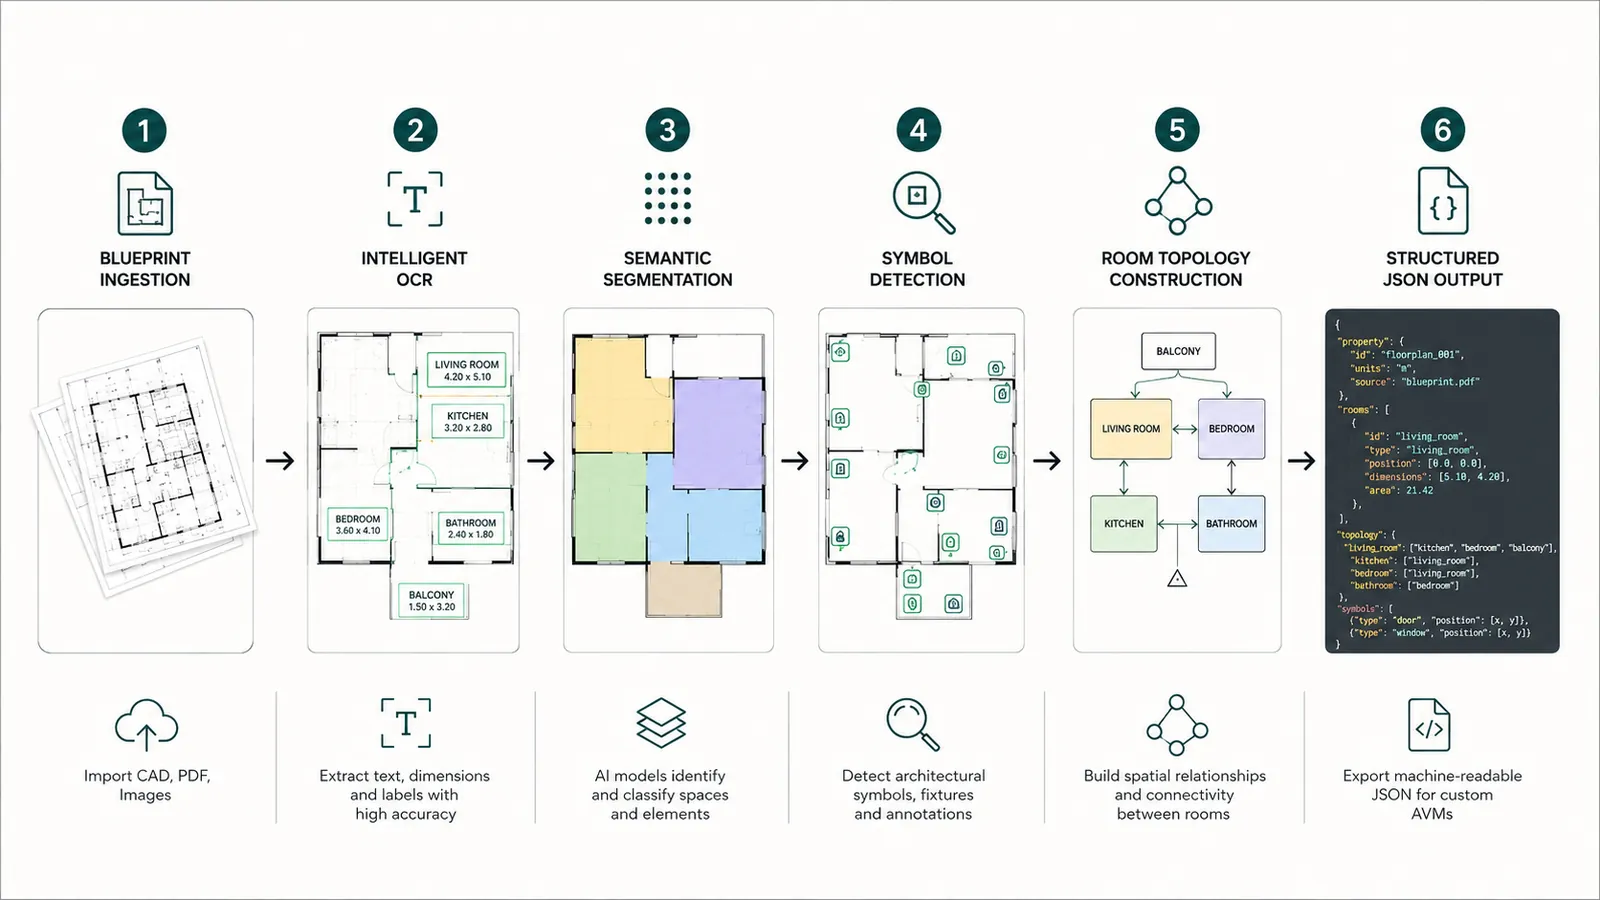
When a plan is available, rooms are segmented and measured, text labels are read, and doors link rooms into a layout graph. This gives measured living area, room sizes and layout type.Room areas and layout featuresDBNet + CRNN OCRU-Net segmentation - Stage 4
Select comparable sales
Recent sales are ranked by distance and property similarity. Their price per square foot, weighted by similarity, sets a base value that the analyst can inspect.Ranked comps with similarity scores - Stage 5
Run the valuation model
A gradient-boosted or ensemble model combines structured data, location, comps and image and layout features. Forecasting models add price trends, rent growth and vacancy risk.Value, range and forecastXGBoostLightGBMMulti-modal fusion - Stage 6
Explain, flag and deliver
Each result carries a confidence score and the features that moved the value. Low-confidence properties go to an analyst. Results are sent to your API, database or underwriting spreadsheet.Explainable valuation reportREST APIExcel / Google SheetsJSON
What we build
Valuation modules, scoped to your deals
Most teams start with one module, usually automated valuation or real estate forecasting, and add others once the data pipeline is in place.
Automated property valuation
Instant values for residential and commercial assets from comparable sales, rent rolls, transactions, zoning and property attributes. The same valuation logic is applied to every deal.Value range and confidence score via APIFuture value and rent forecasting
Forecast values, rents and appreciation from market history, macroeconomic signals, migration and local supply and demand, with scenario analysis.Rent growth, appreciation and vacancy riskForecasting beyond historical compsAI comparable selection
The most relevant comparables are found by geographic and feature similarity, instead of being picked by hand, so values are consistent across analysts.Ranked comps with similarity scoresCondition from listing photos
Photos become structured signals: condition, renovation level, finishes and amenities. These explain price differences that size and location can't.Condition score and feature tagsHow image analysis improves accuracyLayout from floor plans
Room areas, measured living area, room counts and layout type read from plans, adding spatial detail that tax records leave out.Structured JSON for your AVMFloor plan features for AVMsUnderwriting inputs
Raw property and market data converted into underwriting assumptions for acquisitions and lending: NOI estimates, cap rates, IRR projections and investment scores.NOI, cap rate and IRR assumptionsAutomating CRE underwriting
In practice
Valuation and forecasting we have built
Reath AI: CRE market forecasting and rent recommendations
- Rental growth forecasts and rent recommendations
- Renovation simulator that ranks capital expenditure by yield
- Submarket, demographic and rental comps analysis per asset
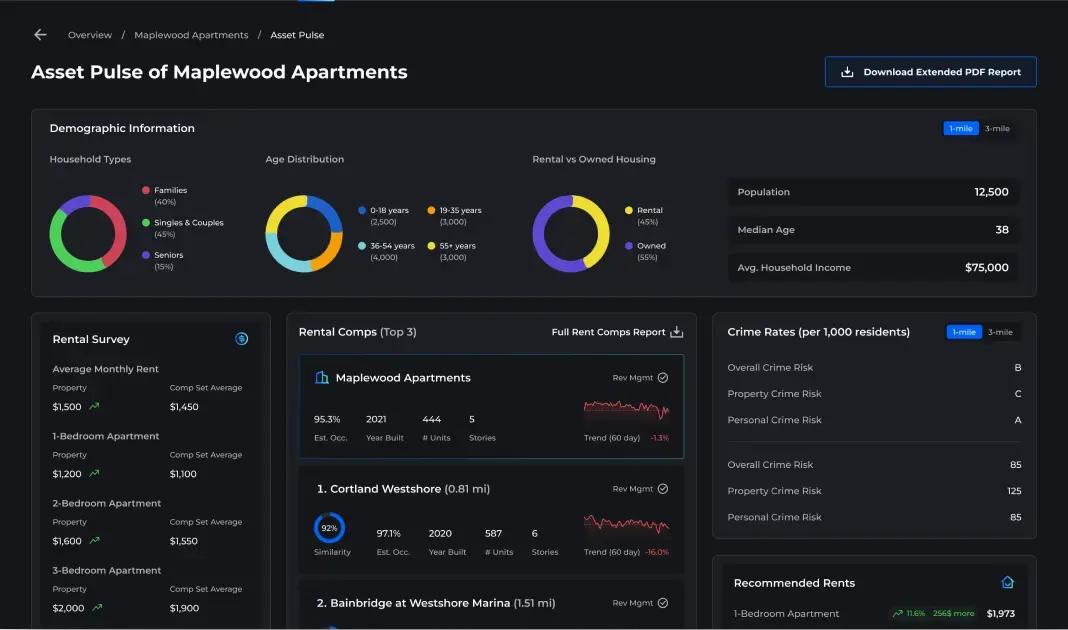
- Less research overhead for investors
- 70%
- Average variance against real-world rates
- <4%
Listing photos turned into condition signals
- Kitchen, bathroom and flooring quality scored
- Pools, garages and other amenities detected
- Kitchen photos can carry more weight than hallways

Floor plans turned into layout features
- Measured living area, not just the listed figure
- Room polygons with areas and labels
- Room adjacency graph for layout quality
Fits your workflow
Values delivered where deals are underwritten
A valuation is only useful if it reaches the people making the offer. We connect the model to the systems your acquisitions and lending teams already use.
Valuations get better with cleaner inputs. Pair the model with offering memorandum parsing and lease abstraction to feed rent rolls and deal terms in automatically.
- Sovereign AI
Private deployment
Runs as containers in your AWS, GCP or Azure account, so deal criteria and underwriting data stay isolated. - How we handle data
API first
Send valuations to acquisitions pipelines such as Dealpath, a CRM such as Salesforce, or internal databases over REST. Spreadsheet sync
Values, comps, cap rate assumptions and forecasts written into your Excel or Google Sheets templates.Monitoring and retraining
Error is tracked against closed sales, and models are retrained as new comps and market data arrive.
Getting started
Back-test it on your own markets first
We measure the model against historical sales in the markets you care about before it touches a live deal.
Step 1: Scoping call
30 minutes
We review your asset types, markets, data sources and how valuations feed your decisions, and tell you what is feasible.
- NDA on request
Step 2: Proof of concept
4–6 weeks
A working model on your data, back-tested against past sales with the error reported market by market.
- Accuracy targets agreed up front
Step 3: Production
Ongoing
Deployed in your cloud, connected to your underwriting tools and retrained as the market moves.
- You own the IP
FAQ
Questions, answered
What lenders, investors and PropTech teams ask before a pilot.
Looking at the wider picture? See all our real estate AI.
It combines several models. Comparable sales are selected by location and property similarity to set a base value. Property attributes, features extracted from photos and floor plans, and neighbourhood factors such as schools, transit access and local development then adjust that base. The output is a value range with the drivers behind it.
Typical sources are MLS feeds, public tax assessor and county deed records, demographic data, zoning codes and commercial data platforms you already license. Listing photos, floor plans, rent rolls and offering memorandums can be added as inputs. Custom connectors let the model read from your own data warehouse.
We back-test value and rent forecasts against historical data for your target markets and report the error (MAPE) before anything goes to production. Models are then recalibrated as new macroeconomic data (inflation, interest rates, employment) and local migration figures come in. For Reath AI, forecasts showed an average variance of less than 4% against real-world rates.
Yes. Similarity weights are configurable, so analysts can give more weight to characteristics such as year built, construction class, renovation status or distance, in line with your underwriting guidelines.
Yes. We build API endpoints and webhooks that write property details, valuation ranges, cap rates and forecast rent growth straight into your Excel or Google Sheets templates.
The valuation engine can run as containers inside your own private cloud (AWS, GCP or Azure) or on your own servers. Transaction and underwriting data stay inside your network and under your own security and compliance policies.
When a property has unusual architecture or few similar sales, the model lowers its confidence score and reports where comparable data was thin. Anything below the confidence threshold you set is routed to an underwriter for manual review instead of being accepted automatically.
Yes. Each comparable sale and adjustment in the report links to the record it came from, such as the county record, MLS sheet or marketing flyer, so an analyst can open the source and check it.
Related
Keep exploring
- PropTechListing image taggingProperty features tagged and compliance issues caught on every listing photo.
- Construction & drawingsFloor plan analysisRooms, walls, doors and symbols read from drawings and returned as structured data.
- Document AIOffering memorandum parsingRent rolls, financials and deal terms pulled from OMs in minutes.
- IndustriesAI for real estateStaging, image tagging, valuation and document AI for brokerages and PropTech platforms.
Book a strategy session
Talk to an AI engineer about your project
Tell us what you want to automate. The first call is a 30-minute working session with an engineer, not a sales pitch.
- Send the form, it takes 2 minutes
- We reply within 1 business day, under NDA if you need it
- A 30-minute call to scope feasibility and next steps