Computer vision systems are often discussed in abstract terms—“AI that sees,” “automation through images,” or “smart cameras.” But in real-world engineering and business environments, the core question is much simpler:
What does it actually cost to build and run a computer vision system?
The answer is not a single number. It is a stack of costs distributed across data, engineering, infrastructure, deployment, and long-term maintenance. Depending on scope, a production-grade system can range from $10,000 prototypes to multi-million-dollar enterprise deployments.
This article breaks down those costs in a realistic way, based on how systems are actually built and operated in production environments.
1. What “Computer Vision System” Actually Means in Practice

Before breaking down cost, it is important to define what we are costing.
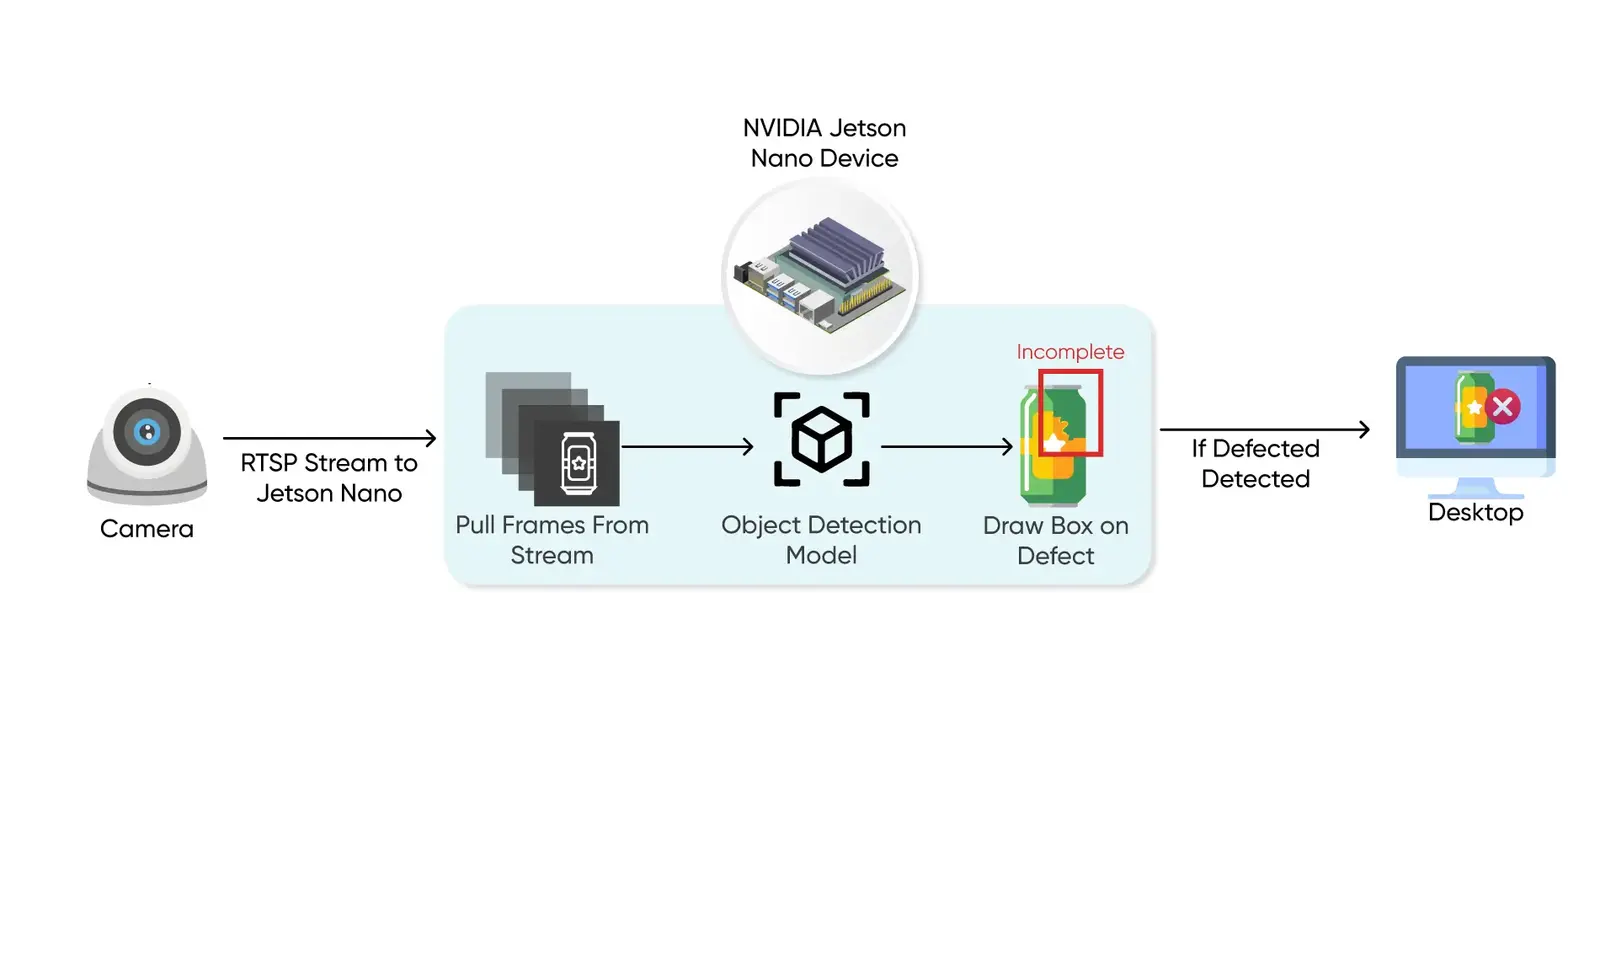
A computer vision system is not just a model. It is a full pipeline:
- Image/video input system (cameras, uploads, streams)
- Data storage and processing layer
- Annotation and labeling pipeline
- Model training and evaluation pipeline
- Inference system (real-time or batch)
- Deployment infrastructure (edge/cloud/mobile)
- Monitoring and retraining loop
Most cost discussions fail because they only consider model training, which is often less than 20–30% of total system cost in production.
2. Major Cost Categories Overview
A production computer vision system typically includes:
- Data acquisition and labeling
- Model development and experimentation
- Compute infrastructure (training + inference)
- Engineering and integration
- Deployment and scaling
- Maintenance and monitoring
We will break each one down.
Why does data collection and labeling dominate computer vision costs?
Data labeling and collection typically consume 30% to 60% of a computer vision project's budget because clean, pixel-level annotation requires intensive manual verification and specialized quality control pipelines.

Why data dominates cost
In real-world systems, data is usually the most expensive component. Not because storage is expensive, but because clean, labeled data is labor-intensive.
| Tool Category | Popular Platforms | Pricing Tiers (2026) | Best Used For | Reference / Source |
|---|---|---|---|---|
| Annotation | Labelbox / CVAT (Self-hosted) | $0 (Open-source) to $15,000/yr (SaaS) | Multi-modal labeling & workforce orchestration | Labelbox & CVAT 2026 enterprise catalogs |
| Model Management | Weights & Biases / MLflow | $0 (MLflow local) to $500/user/mo | Experiment tracking & model registry | W&B enterprise licensing guidelines |
| Vector Database | Pinecone / Milvus (Self-hosted) | $0 (Milvus local) to $0.096/hr/pod (Pinecone) | Storing and searching visual similarity embeddings | Pinecone serverless pricing sheets |
3.1 Data collection
Depending on the use case:
- Existing datasets (free or paid): $0 – $50,000
- Custom image capture (industrial cameras, field data): $5,000 – $200,000+
- Video stream collection pipelines: $10,000 – $500,000 depending on scale
Industries like manufacturing, healthcare, or surveillance often require custom data capture pipelines, which increases cost significantly.
3.2 Data labeling
Labeling is where most budgets expand unexpectedly. Typical pricing:
- Simple classification: $0.02 – $0.10 per image
- Bounding boxes: $0.05 – $0.50 per image
- Segmentation masks: $0.50 – $5.00 per image
- Video annotation: $5 – $50 per minute of video
Annotation cost by complexity
Classification
$0.02 - $0.10
Bounding Boxes
$0.05 - $0.50
Segmentation
$0.50 - $5.00
Video Annotation
$5 - $50 / min
For example, 100,000 bounding box annotations can cost $10,000, and a 1 million image set can exceed $100,000 in raw annotator labor alone. If using managed labeling platforms or human-in-the-loop services, costs increase further.
"A common pitfall is treating data annotation as a one-time setup fee, whereas it is actually a continuous operational cost driven by model retraining cycles." — Naeem Maqsood, CTO at AxcelerateAI.
3.3 Labeling infrastructure
Beyond human labor:
- Annotation tools (CVAT, Labelbox, Roboflow): $0 – $50,000/year
- Workforce management systems: $10,000 – $100,000/year
- Quality control pipelines: engineering cost (hidden)
Key takeaway
For most real systems:
Data + labeling = 30% to 60% of total project cost
4. Model Development and Experimentation Costs
This includes designing, training, and validating models.
4.1 Engineering team cost
A typical team:
- 1–2 ML engineers
- 1 data engineer
- 1 backend engineer (sometimes shared)
- 1 product/solution architect
Salary ranges (global approximation):
- Junior ML engineer: $40K – $80K/year
- Mid-level: $80K – $150K/year
- Senior: $150K – $300K+
For a 3–6 month MVP:
- Small team cost: $30,000 – $200,000
4.2 Model experimentation
Experimentation includes:
- Model selection (YOLO, Faster R-CNN, Vision Transformers)
- Hyperparameter tuning
- Dataset balancing
- Augmentation strategies
Compute costs:
- Single GPU (NVIDIA T4/A100 class): $0.5 – $5/hour
- Training runs: $500 – $20,000 per project phase
A serious CV project often runs:
- 50–500 experiments
- Total compute: $2,000 – $50,000+
Key insight
Modern CV systems are not “train once and deploy.” They are iterative systems, and experimentation cost grows with ambition.
5. Compute Infrastructure Costs
This includes training and inference infrastructure.

5.1 Training infrastructure
Options:
- Cloud GPUs (AWS, GCP, Azure)
- On-prem GPU servers
- Hybrid setups
Example cloud pricing:
- NVIDIA T4: ~$0.50 – $1/hour
- NVIDIA A100: ~$2 – $5/hour
Training large models:
- Small models: $1,000 – $10,000 total
- Large-scale models: $10,000 – $500,000+
5.2 Inference infrastructure (production cost driver)
This is often underestimated.
Costs depend on:
- Number of requests per second
- Model size
- Latency requirements
- Edge vs cloud deployment
Typical setup:
Cloud inference:
- $100 – $10,000/month for small systems
- $10,000 – $100,000+/month for scaled systems
Edge deployment:
- Hardware cost per device: $100 – $2,000
- Maintenance and updates increase operational overhead
Real-world note
Many companies underestimate inference cost because they assume training is the main expense. In production, inference often becomes the long-term dominant cost.
6. Engineering and Integration Costs
A computer vision model alone has no business value unless integrated into a system.
This includes:
- API development
- Backend integration
- Frontend dashboards
- Camera or sensor integration
- Security layers
- Data pipelines
Typical cost range:
- Small integration system: $10,000 – $50,000
- Medium enterprise system: $50,000 – $250,000
- Large distributed systems: $250,000 – $1M+
Hidden complexity
Integration cost grows with:
- Number of camera sources
- Real-time requirements
- Multi-site deployments
- Compliance requirements (healthcare, finance, surveillance)
7. Deployment and Scaling Costs
Deployment is not a one-time activity.
Includes:
- CI/CD pipelines for ML models
- Model versioning systems (MLflow, Kubeflow)
- Load balancing
- Edge deployment orchestration
- Rollback mechanisms
Cost breakdown:
- DevOps setup: $10,000 – $100,000
- MLOps platform: $5,000 – $50,000/year
- Scaling infrastructure: variable ($1,000 – $100,000+/month)
8. Maintenance and Lifecycle Costs
This is the most ignored category in early planning.
Includes:
- Model retraining (data drift)
- Monitoring performance degradation
- Bug fixes in pipelines
- Hardware replacement (edge devices)
- Data updates
Annual cost:
Typically:
- 15% – 40% of original system cost per year
For example:
- $200,000 system → $30,000 – $80,000/year maintenance
Annual maintenance overhead
15% - 40% of base build cost per year
Data & Environment
- Camera shifts & angles
- Lighting modifications
- Packaging updates
MLOps Pipeline
- Accuracy monitoring
- Drift logging
- Automated retraining
Hardware Lifecycle
- Physical cleaning
- Field repairs
- Firmware updates
9. Example Cost Scenarios
Project scaling tiers
Small Prototype
$20k - $30k
- Single defect focus
- Pre-captured data
- Isolated engineering scope
Mid-Scale Industrial
$250k - $400k
- Warehouse automation
- Local infra deployment
- Pipeline validation
Enterprise-Scale
$1M - $5M+
- Multi-site surveillance
- High-scale ingestion
- Full platform engineering
9.1 Small prototype system
Use case: simple defect detection in images
- Data + labeling: $5,000
- Model training: $3,000
- Engineering: $15,000
- Infrastructure: $2,000
Total: $20,000 – $30,000
9.2 Mid-scale industrial system
Use case: warehouse automation or quality inspection
- Data: $50,000
- Labeling: $80,000
- Engineering: $120,000
- Infrastructure: $50,000
- Deployment: $40,000
Total: $250,000 – $400,000
9.3 Enterprise-scale system
Use case: multi-site surveillance or retail analytics
- Data + labeling: $500,000+
- Engineering team: $500,000 – $2M/year
- Infrastructure: $100,000 – $1M/year
- Maintenance: ongoing
Total: $1M – $5M+
10. Key Cost Drivers (What Actually Moves the Budget)
Across all systems, cost is driven by:
- Data availability (biggest factor)
- Real-time vs batch processing
- Accuracy requirements (higher accuracy = more iteration)
- Scale (number of cameras/users/sites)
- Deployment type (cloud vs edge)
- Industry compliance requirements
For small and medium organizations looking to determine if these expenses justify the operational gains, see our ROI checklist in Is Computer Vision Worth It for Small and Mid-Sized Companies?.
11. Common Misconceptions
Misconception 1: “Model is the product”
Reality: The model is often 10–20% of the system.
Misconception 2: “Open-source models make it cheap”
Reality: They reduce experimentation cost but not system integration, data, or deployment cost.
Misconception 3: “Once deployed, it’s done”
Reality: Most cost comes after deployment in monitoring and retraining.
12. Final Takeaway
A computer vision system is not a single AI model—it is a continuous engineering system.
A realistic cost structure looks like:
- Data & labeling: 30–60%
- Engineering & integration: 20–40%
- Infrastructure (training + inference): 10–30%
- Maintenance: ongoing 15–40% yearly
Total cost of ownership split
- 30% - 60%
Data & Labeling
Custom capture and labor-intensive annotation pipelines.
- 20% - 40%
Engineering & Integration
APIs, backends, and complex multi-camera source integrations.
- 10% - 30%
Compute Infrastructure
Cloud/on-prem training clusters and continuous production inference.
- 15% - 40%
Ongoing Maintenance
Yearly budget for data drift retraining and performance monitoring.
The key insight for both developers and executives is this:
The cost is not in building the model. The cost is in making it reliable, scalable, and maintainable in the real world.
If you want, I can also:
- Convert this into a LinkedIn article version
- Add diagrams (system architecture + cost breakdown flow)
- Or tailor it for a specific industry like healthcare, retail, or manufacturing
Engineering Cost Summary
Data & labeling (30-60%)The largest cost driver, due to manual annotation and custom acquisition pipelines.
Maintenance (15-40% yearly)Continuous MLOps, drift monitoring, and retraining are essential for production.